Filtering and drilling-down

Analytics is an embedded reporting tool that allows you to create, monitor, and export live dashboards that visualise data about your grants.
This article explains how to filter dashboard data and drill down into widgets. These important functions allow you to get more specific with your data analysis.
Table of contents
Filtering your dashboard
You can use filters to narrow down the data that is represented in your dashboard(s). Data can be filtered in two ways:
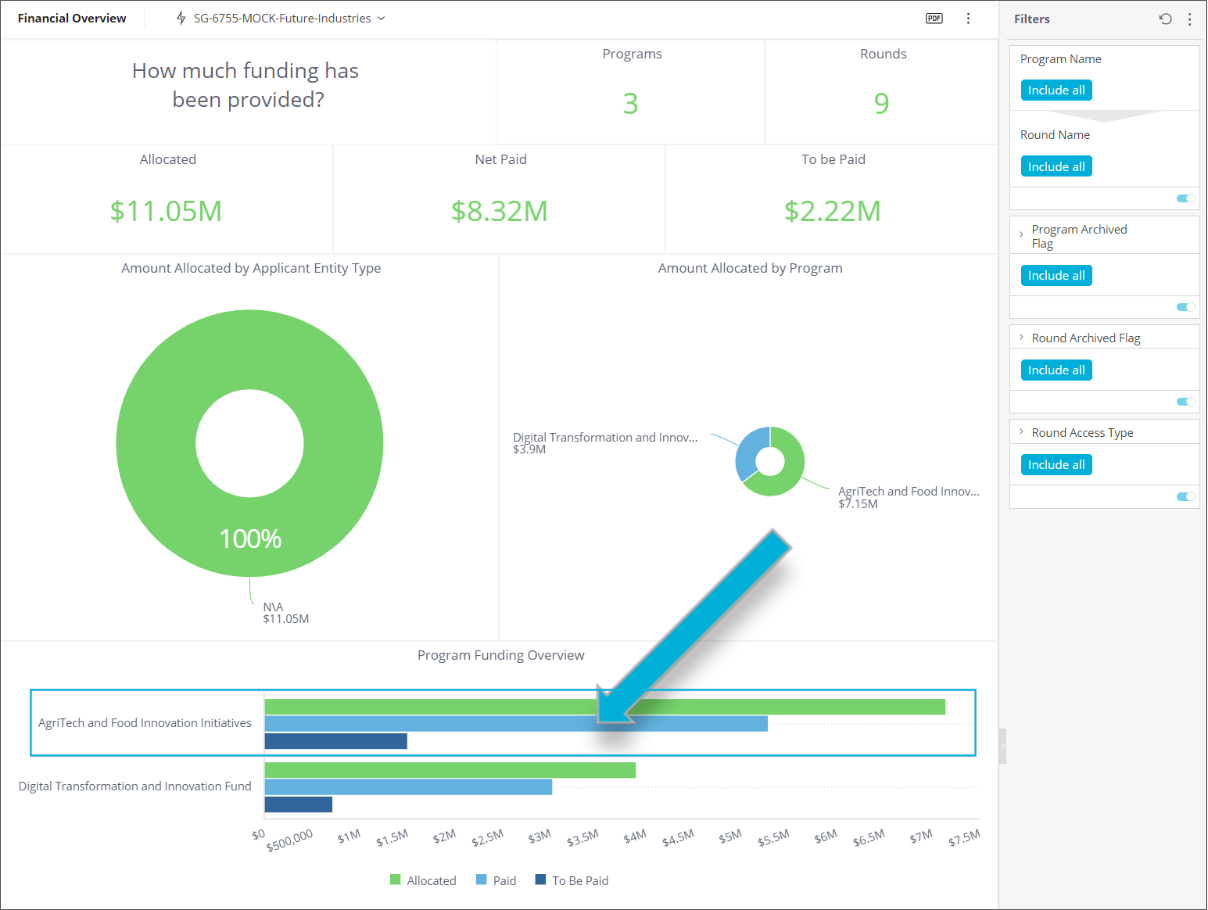
Selecting elements within the widgets directly; for example, selecting one of the bars in the Program Funding Overview widget below will update the Program Name dashboard filter, and all widgets in the dashboard will be refreshed to show only that data:
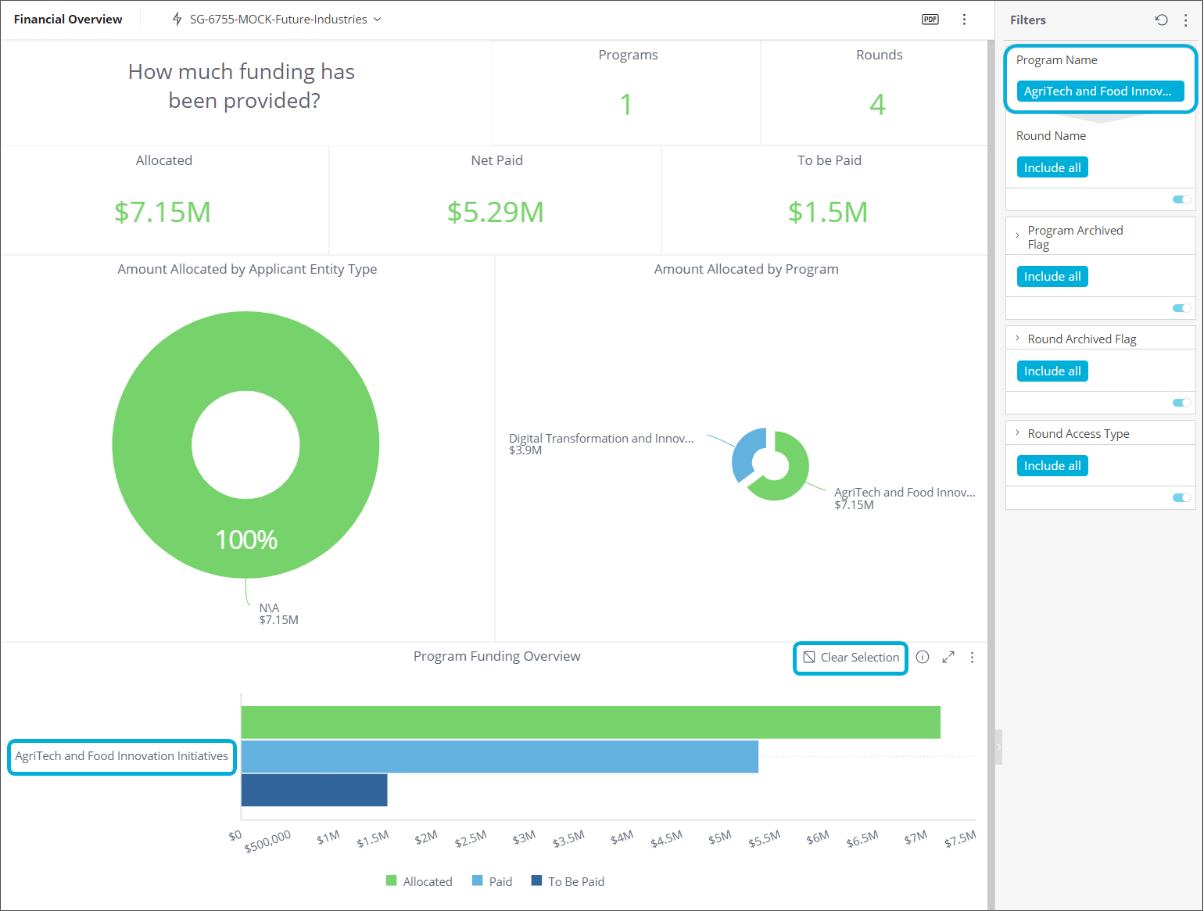
To revert the data back (clear the filter), hover over the Program Funding Overview widget and select Clear Selection.
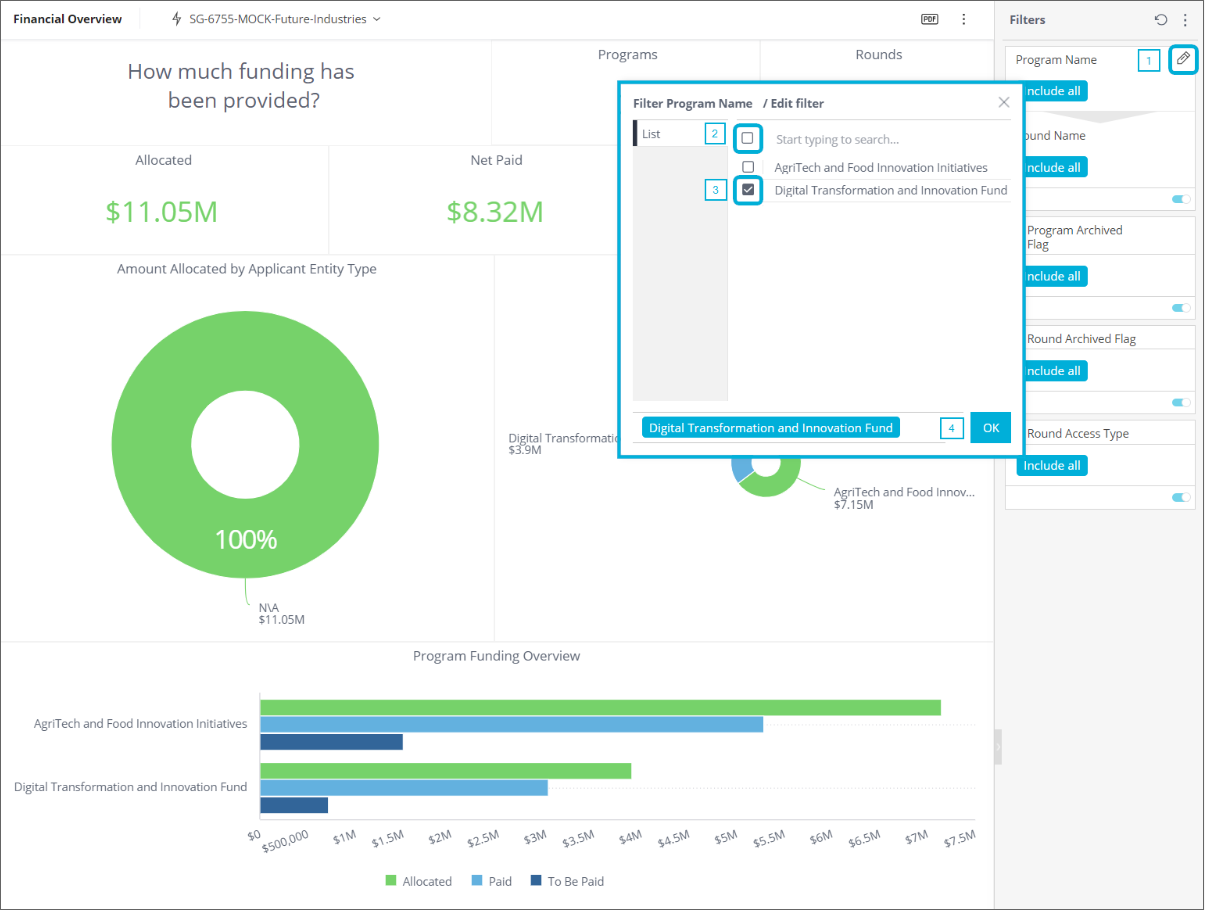
You can also filter by selecting subsets of the data in the right-hand Filters pane; for example: select the pencil for the Program Name dashboard filter, then select the top box to deselect all currently selected programs, then select the Digital Transformation and Innovation Fund program and select OK:
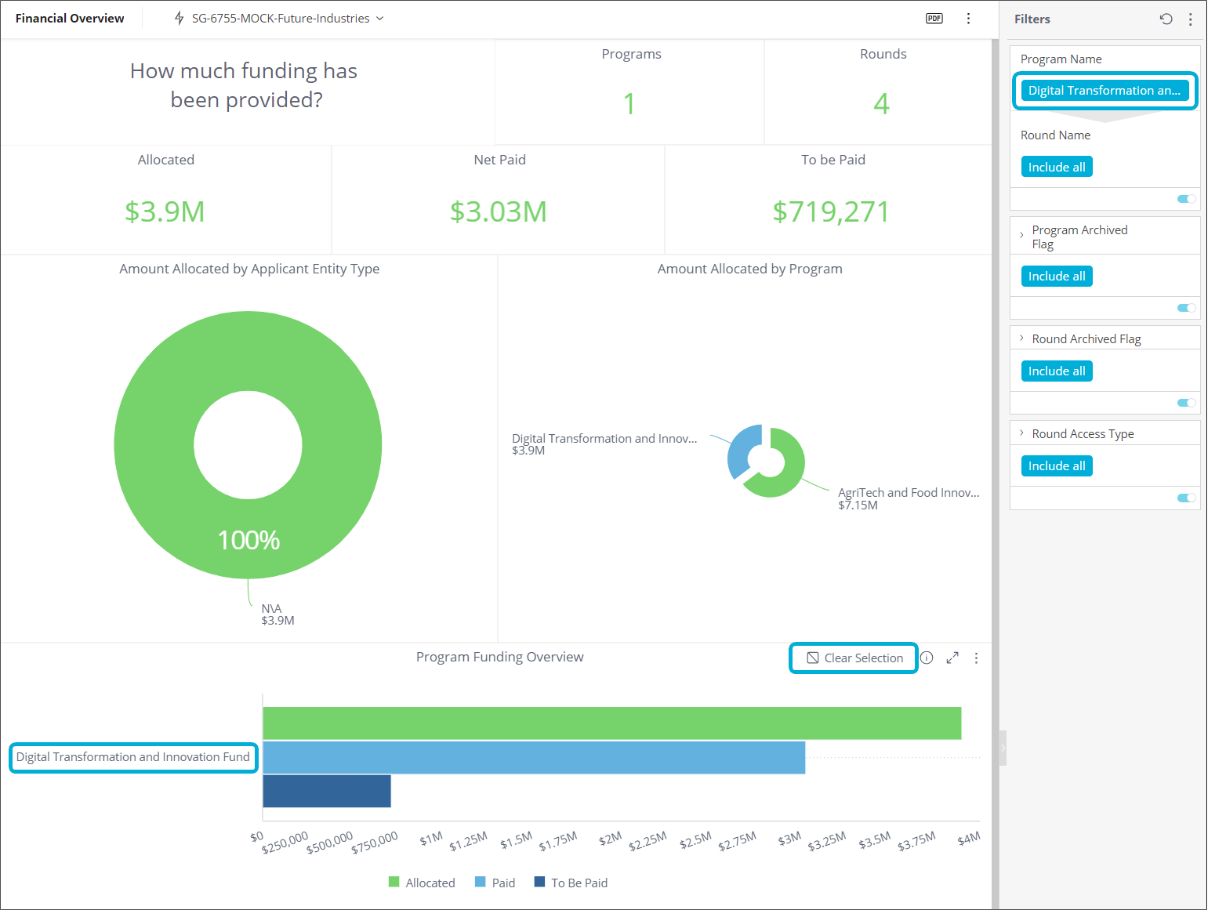
To revert the data back (clear the filter), reverse the previous steps or select Clear Selection on the Program Funding Overview widget.
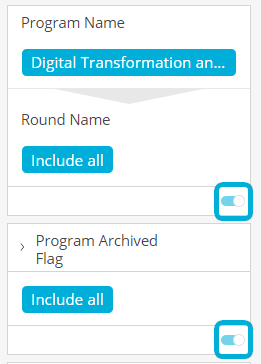
Note the toggle in the bottom-right of each filter that enables you to quickly disable/enable it:
Dependent Filters
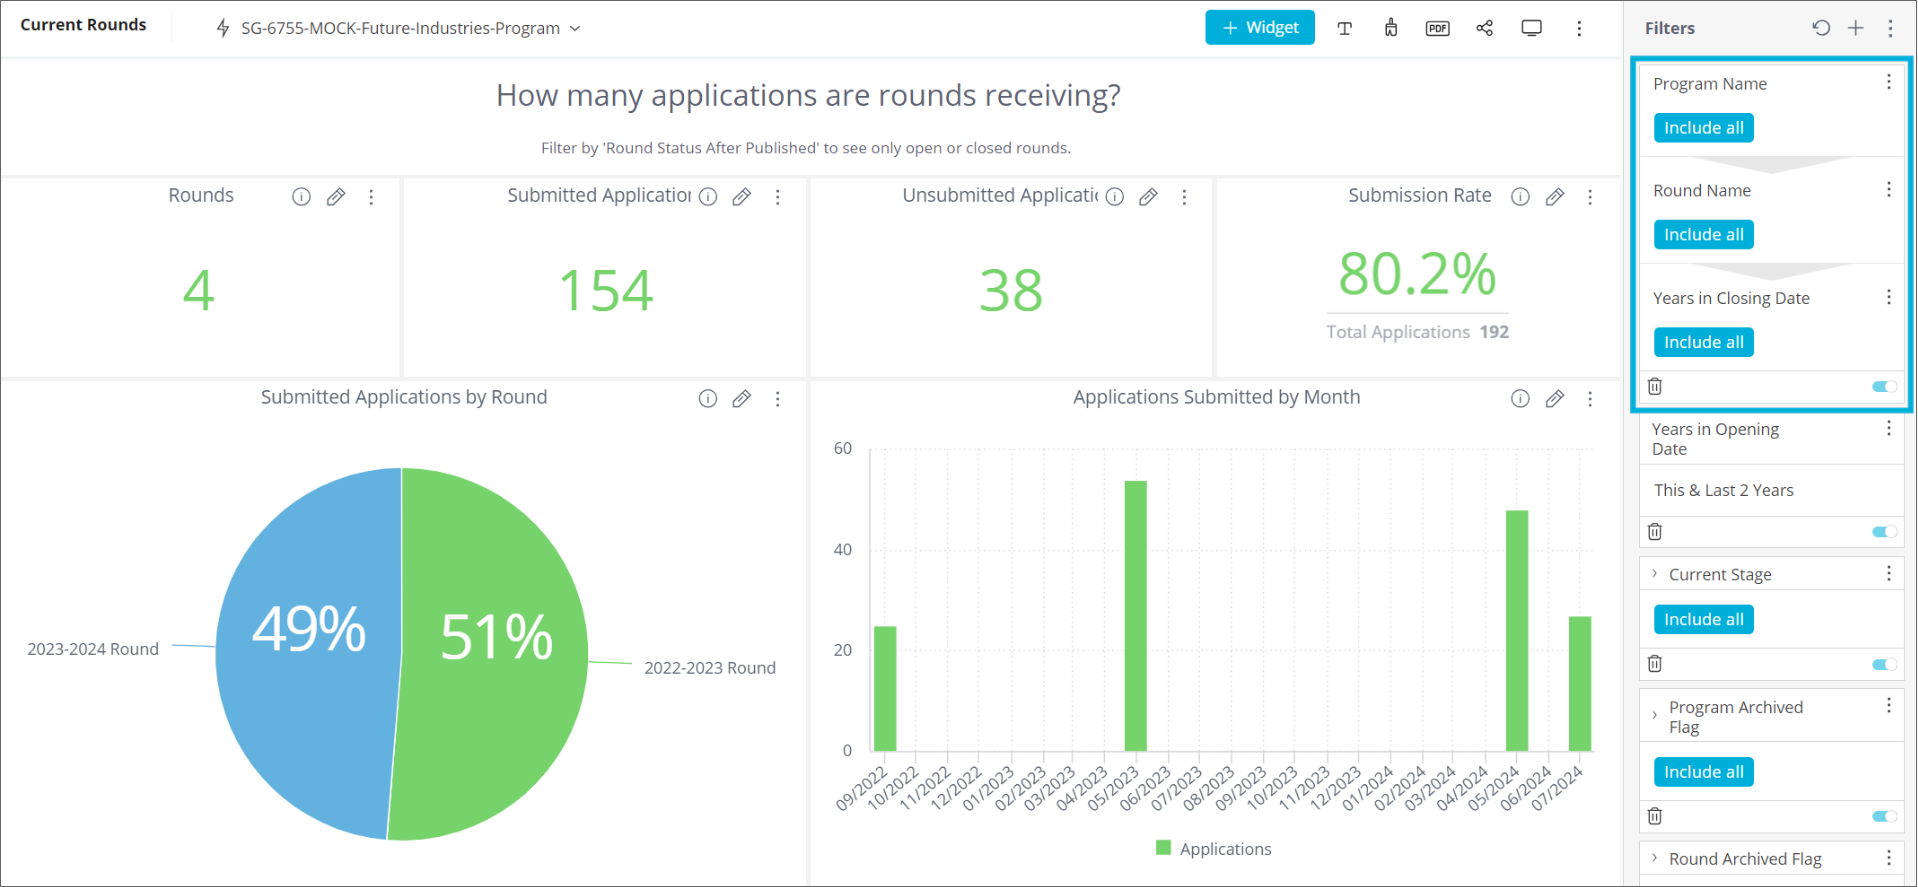
Consider the below Current Rounds dashboard example which has a filter comprising 3 levels (Program Name > Round Name > Years in Closing Date) :
When a Program Name filter is applied, if you wish to add an additional Round Name filter the options displayed there will be restricted to those applicable for the selected Programs.
To create a dependent filter:
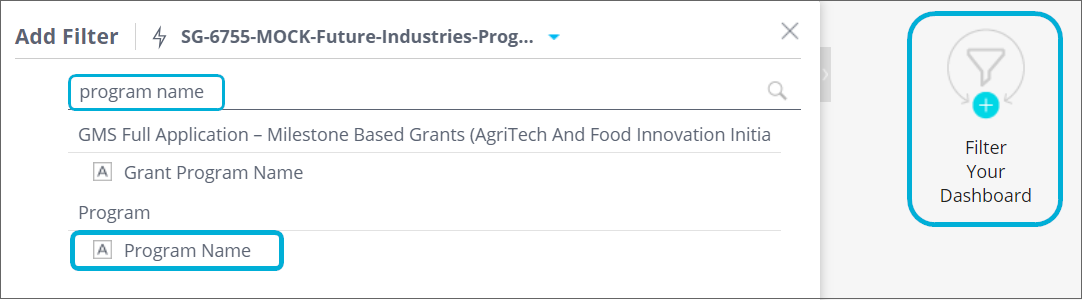
The top-level (most inclusive) filter of the Dependent Filter (Program Name in the above example) must first be defined in the usual manner. Select + Filter Your Dashboard (or select the + next to Filters at the top of the right-hand side panel), enter program name in the search field and select Program Name from the Program table:
Select OK. This newly added filter then appears on the dashboard.
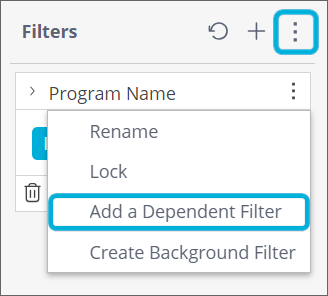
On the parent filter (Program Name), select the 3 dots menu and select Add a Dependent Filter:
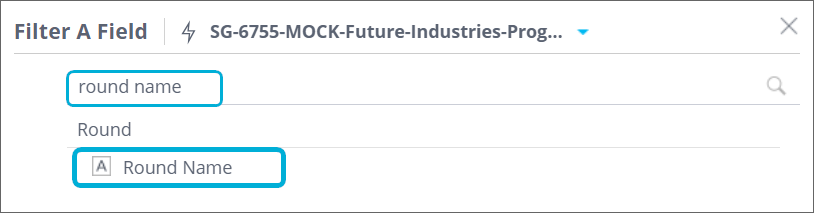
Search and select Round Name from the Round table:
Select OK. The child filter appears on the dashboard with a downwards pointing arrow between Program Name and Round Name, indicating the parent filter and its dependent filter below.
Repeat this step for the remaining child filters (eg: Closing Date from the Round table) to create as many sub-levels of Dependent Filter as you need, in our example:
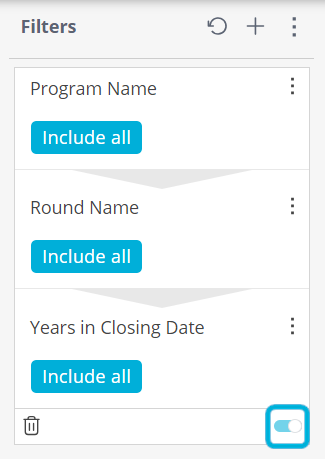
Note that you can enable/disable the entire dependent filter using the toggle in the bottom right corner of the filter.
Drilling down in a widget
A useful feature is the ability for users to drill down on a widget to get an in-depth view (or breakdown) of a selected value. You can normally drill down from any field to any other related field. To drill down into a chart:
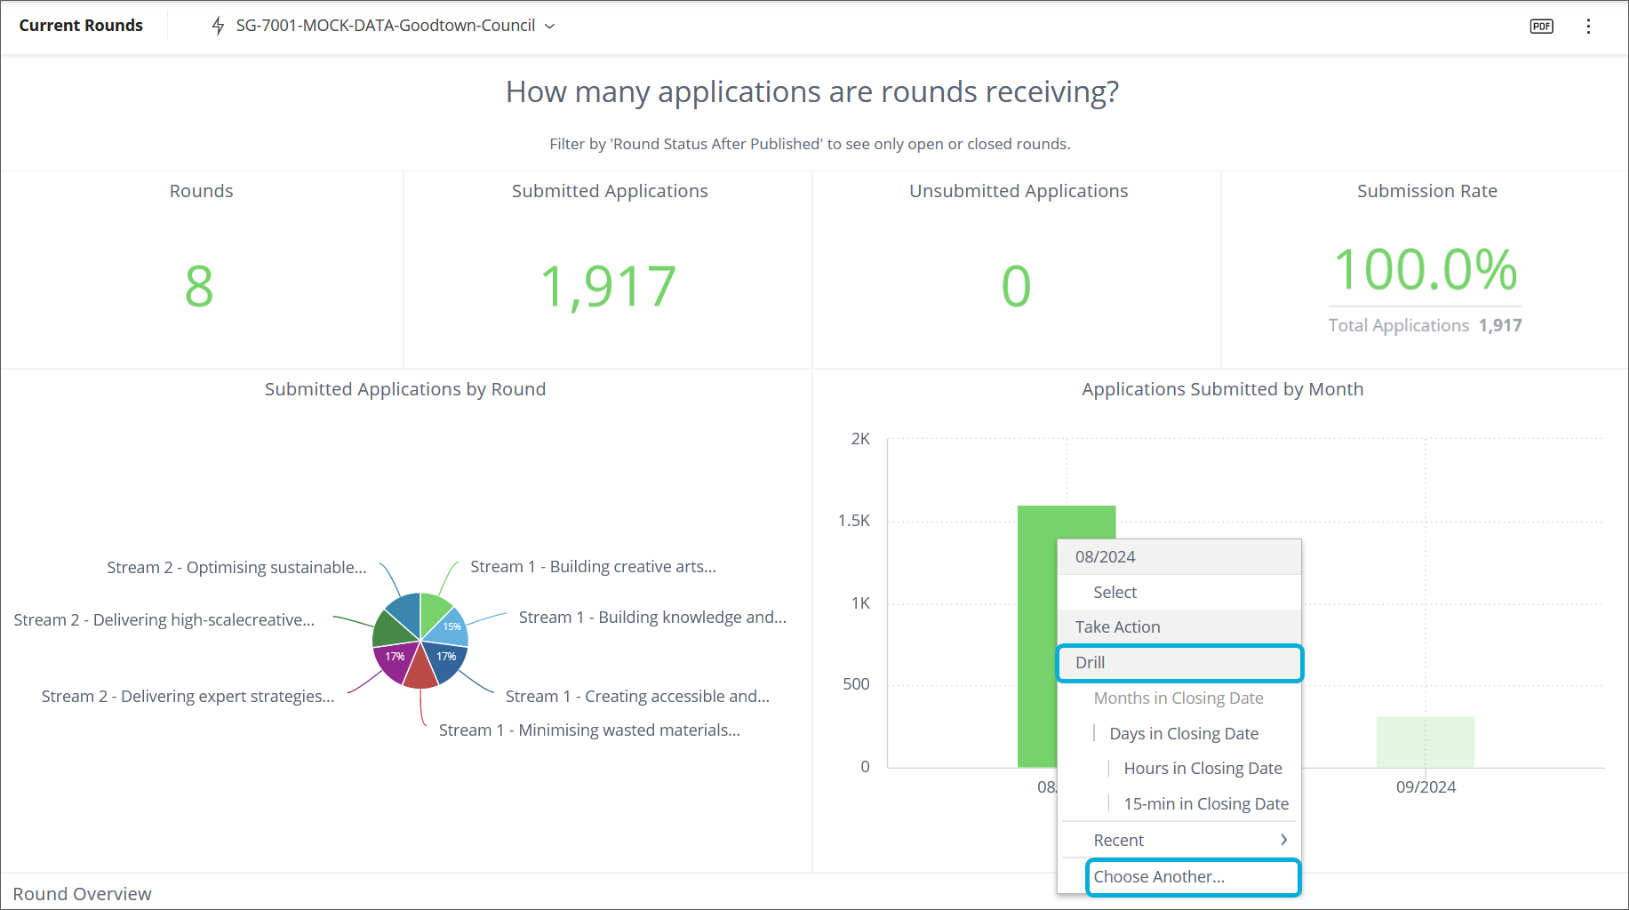
Right-click on the item in the widget which you want to drill down.
If you have already drilled into this chart, then you will already have shortcuts to previously selected fields. Otherwise, to select a different field for the first time, select Drill > Choose Another...
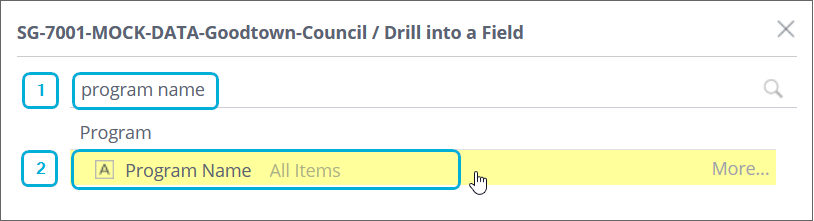
Type in the name of the attribute you want to drill down to, and select it, for example program name :
The chart will be updated to show the new breakdown. This example shows the breakdown of Applications Submitted, by program, within the 08/2024 month:
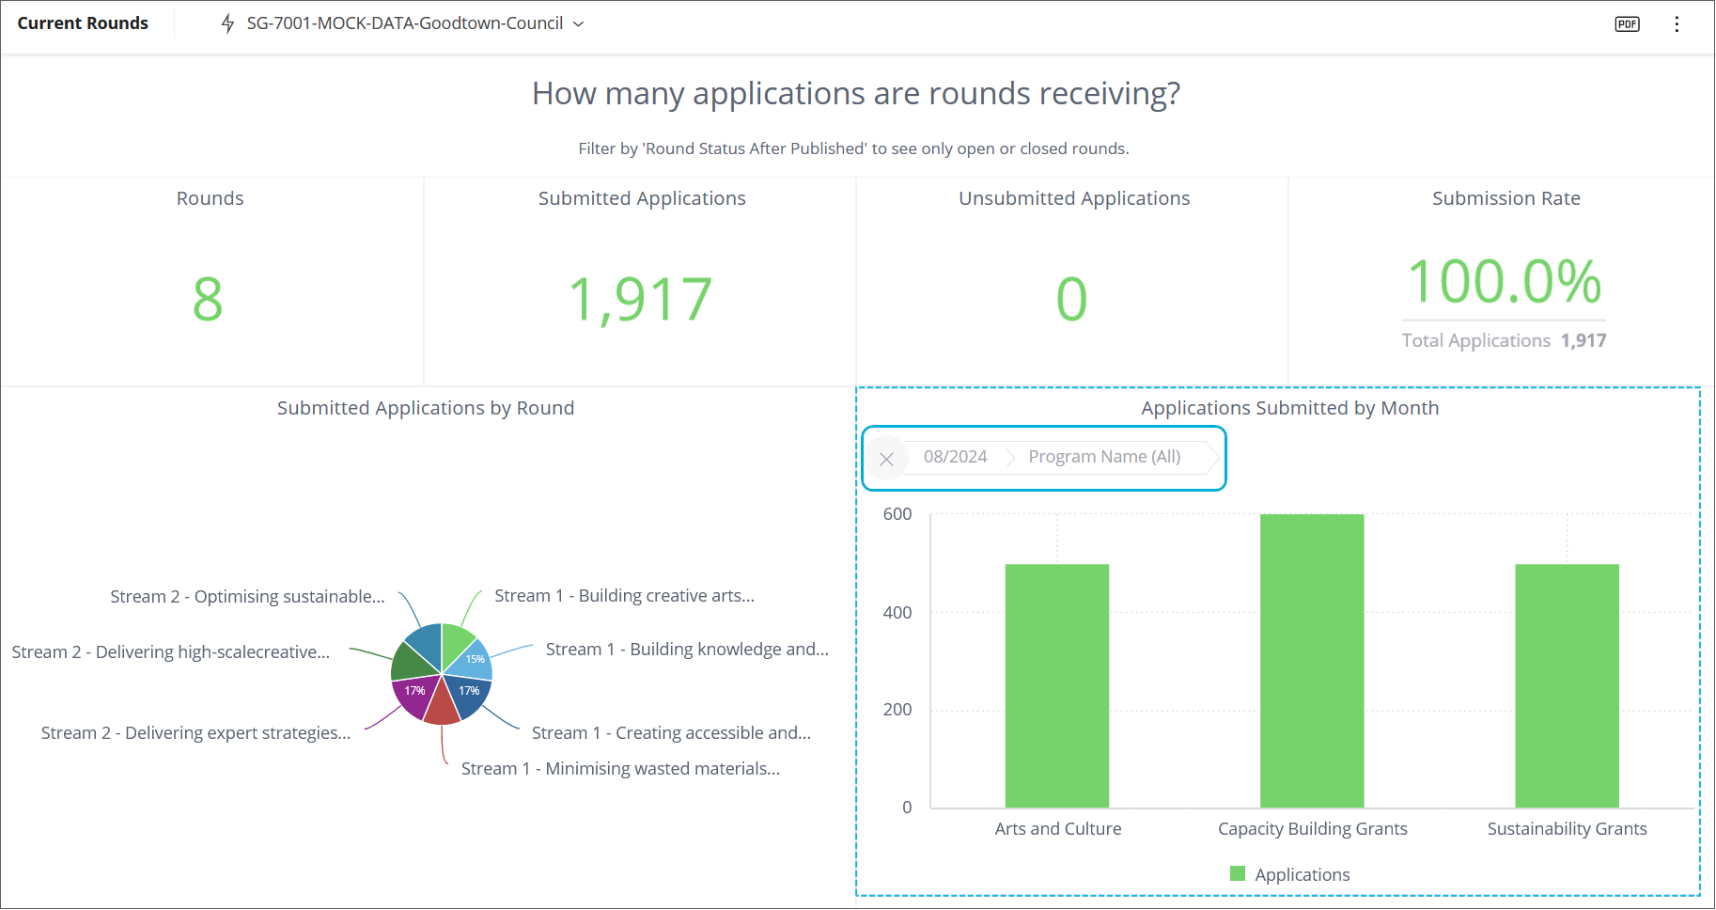
Note the breadcrumbs showing the drill down used. In the above example, it is the month 08/2024 which was right-clicked on, followed by the selected attribute: Program Name (All).
To clear this and revert to the previous configuration, select the X to the left of the breadcrumb.
Tip: If you have already drilled into this chart, you will already have shortcuts to the previously selected fields.
What's next?
You might like to explore the default dashboards, share and export your dashboards, or progress to make your own custom dashboards.